


Concentration of positive control, trypsin? 20 patients, 5 healthy donors for IgM studies; 45 patients and (how many?) healthy donors for IgG studies. Enough sample size?


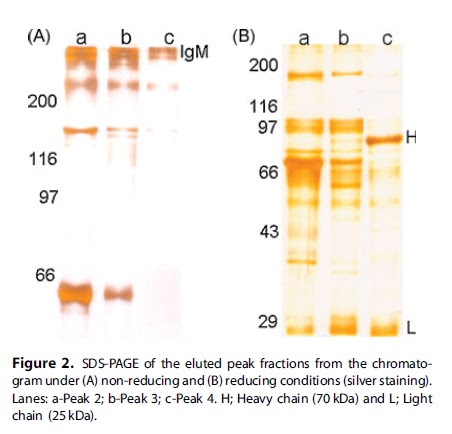
The IgM here is supposed to contain just two bands for the heavy and light chains shown in lane c of Fig. 2B (reduced conditions) but again, there are some more bands in that lane. But in Fig. 2A (non-reducing conditions), lanes a, b and c show several bands. The authors state that peak 4 had homogeneous IgM, yet the lane corresponding to peak 4 (lane c of Fig. 2A) also shows (at least) two bands besides the two at the top. What could be the explanation for this?


IgG here looks like it's always got lower proteolytic activity than IgM even though roughly 5 fold more IgG was used. Was this the same IgG purified for the 2009 paper? How about purifying IgG using any of the conditions used for purification of IgG antibodies with CIM disks so that fresh IgG could be compared to IgM here?
How significant would the differences in proteolytic activity be for IgG and IgM from sera of healthy donors and patients?

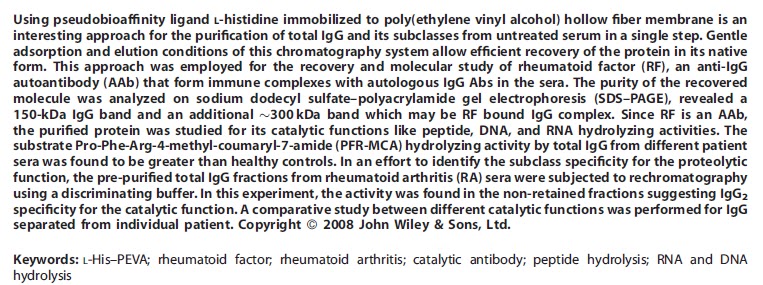
These two figures are from the 2009 JMR paper (title given below). Proteolysis, DNA and RNA hydrolysis were compared for the IgG. Why were all three not tested for IgM (especially considering the RNAse activity for IgG)?


No comments:
Post a Comment